Metrics Advisor
/Metrics Advisor is an Azure Cognitive Service that uses AI to automate the detection of anomalies in time series data. The service is able to ingest metric data from various sources (e.g. Azure Data Lake Storage, Azure Cosmos DB, Azure SQL Database, etc), use machine learning to automatically find outliers, and provide diagnostic insights to aid root cause analysis.
Once Metrics Advisor has been deployed within an Azure subscription, there are two methods of interfacing with the service:
SDK (C#, Python, Java, JavaScript, REST API)
Web-Based Workspace (GUI)

Example Use Cases
Prevent fraudulent credit card activity that deviates from historical norms.
Identify unusual behavior of equipment in a manufacturing plant using sensor data.
Develop an intrusion detection system by monitoring web application logs.
Identify anomalies in stock markets which may indicate market manipulation.

High-Level Process
Ingest: Onboard time-series data.
Configure: Fine tune detection configurations & subscribe to real-time anomaly alerts.
Analyse: Diagnose incidents & identify key contributors.

Features
Data Ingestion: Ability to ingest metric data from a variety of sources (e.g. Azure Data Lake Storage, Azure Cosmos DB, Azure SQL Database, etc).
Automated model selection: Metrics Advisor automatically selects the best model for your data, no machine learning expertise required.
Support for multi-dimensional metrics: For example, a metric Revenue could have a dimension Category with values Food, Apparel, etc., which would allow viewing either Revenue across all categories or for each category individually.
Alerts: Send real-time alerts through multiple channels (Email, Web API, AzureDevOps).
Automated root cause analysis: Metrics Advisor will try to provide automatic suggestions for likely causes of an incident. Note: If a metric has no dimensions, the root cause will be itself.
Incident Tree: Manual root cause analysis by drilling up or down a metric based on the associated dimensions.
Feedback: Add feedback to one point or multiple points that will affect future predictions (e.g. should or shouldn’t be an anomaly).
Metrics Graph: While Metric Advisor monitors each metric independently, some metrics may relate to one another. Create a visual graph structure to show the relationships between related metrics.

Recommended Minimum Data Volumes
Recomennded minimum amount of historical data for Metrics Advisor to perform accurate anomaly detection. The duration of recommended historical data will vary depending on the granularity of your data (minutes, hours, days, months, etc).
| Granularity | RECOMMENDED AMOUNT OF DATA |
|---|---|
| < 5 minutes | 4 days of data |
| 5 mins to < 1 hour | 28 days of data |
| > 1 day to 31 days | 4 years of data |
| > 31 days | 48 years of data |
Historical Anomaly Detection
Metrics Advisor will only perform anomaly detection on data points after a certain earliest timestamp, this will vary based on the granularity of your data.
| Granularity | Onboard Time |
|---|---|
| < 5 minutes | 13 hours |
| 5 mins to < 1 hour | 4 days |
| > 1 hour to < 1 day | 14 days |
| 1 day | 28 days |
| > 1 day to 31 days | 2 years |
| > 31 days | 24 years |
Ingestion Options
By default, Metrics Advisor will ingest new data points based on the specified granularity of the data feed (e.g. a daily data feed will be ingested one day after its timestamp). Note: This ingestion time can be shifted (forwards or backwards) by altering the Ingestion Time Offset parameter. See documentation for more details.
| Granularity | Min Retry Interval | Stop Retry After |
|---|---|---|
| Hourly, Custom (< 1 Day) | 10 mins | 72 hours |
| Daily, Custom (>= 1 Day), Weekly, Monthly | 30 mins | 7 days |
| Yearly | 1 day | 7 days |
Data Schema Requirements
Metrics Advisor accepts tables of aggregated data which adhere to the following schema requirements.
| Attribute | Required | Cardinaltiy | Type | Format |
|---|---|---|---|---|
| Measure | Required | 1 or more | Numeric | |
| Timestamp | Optional | 0 or 1 | DateTime or String | yyyy-MM-ddTHH:mm:ssZ |
| Dimension | Optional | 0 or more | Categorical |
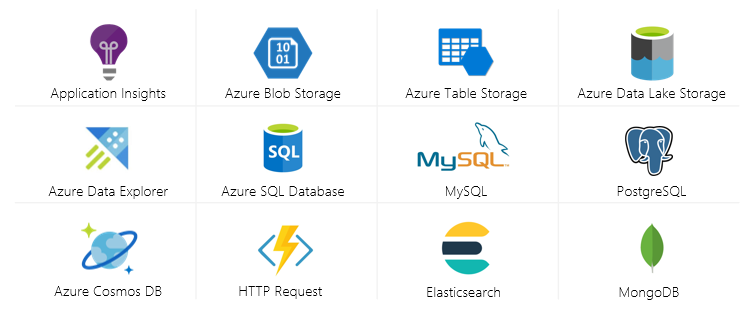
Supported Data Sources
Azure Application Insights
Azure Blob Storage (JSON)
Azure Cosmos DB (SQL)
Azure Data Explorer (Kusto)
Azure Data Lake Storage Gen2
Azure SQL Database | SQL Server
Azure Table Storage
Elasticsearch
HTTP Request
MongoDB
MySQL
PostgreSQL
Local files (CSV)
Anomaly Detection Demo: S&P 500 Index
The S&P 500 is a popular stock market index that measures the performance of 500 large companies listed on stock exchanges in the United States. This demo will show how you can onboard this data and subscribe to receive alerts when Metrics Advisor detects an anomaly (e.g. close price drops unexpectedly).
Required Azure Resources
Resource Group
Metrics Advisor
Azure SQL Database
Data Source
Data Source: Yahoo Finance
Granularity: Daily
Metric: Close
Time Period: 2000-01-01 till 2020-11-06
1. Prepare Data Feed
CREATE TABLE stocks (
    trading_date datetime,
    close_price decimal(11,6),
);
2. Onboard Time-Series Data
Navigate to the Metrics Advisor Workspace
From the Metrics Advisor navigation bar, click Add data feed
Populate the Connection settings
Source Type: Azure SQL Database
Granularity: Daily
Ingest Data Since: 2020-01-03
Authentication Type: Basic
Connection String: Copy/paste this value from your Azure SQL Database resource under Connection strings
Query: select * from stocks where trading_date >= @StartTime and trading_date < dateadd(DAY, 1, @StartTime)
Data Feed Name: Stocks
Set the Schema configuration
Measure: close_price
Timestamp: trading_date
Click Submit
Note: This will initiate the model building/enrichment process which can take several minutes to hours to complete depending on the volume of data being ingested.

3. Browse Series (Metric)
From the Metrics Advisor navigation bar, click Data feeds
Click the arrow to expand the Stocks data feed to reveal the metrics
Click close_price
Update the calendar picker to return data between 2020-01-01 - 2020-11-08
Note: As this example uses data with Daily granularity, Metrics Advisor will only run historical anomaly detection on the last 28 days. Therefore significant dips in the S&P 500 as occurred in March 2020 due to the pandemic are not detected as this is greater than the historical onboarding time.

4. Create a Hook
A hook is an action on an external service that can be triggered when an alert is raised. Metrics Advisor currently supports three types of hooks: Email, Web (HTTP), and Azure DevOps.
From the Metrics Advisor navigation bar, click Hooks
Click Create hook
Populate the hook properties
Hook Type: Email
Name: e.g. Contoso Distribution List
Email to: e.g. support@contoso.com
External Link: e.g. https://www.taygan.co
Customized anomaly alert title: e.g. Anomaly Detected: ${datafeedName}, ${metricName}
Click OK
Note: Email settings will need to be configured as a pre-requisite before Metrics Advisor can send alerts via email. In order to make this menu item visible, the Cognitive Services Metrics Advisor Administrator role needs to be assigned (Metrics Advisor > Access Control (IAM) > Add role assignment > Cognitive Services Metrics Advisor Administrator). See documentation for more detail.

5. Create an Alert Configuration
From the Metrics Advisor navigation bar, click Data feeds
Click the arrow to expand the Stocks data feed to reveal the metrics
Click close_price
Under Alerting configurations, click the plus symbol
Provide a Configuration name (e.g. All Stock Anomalies)
Select a Hook (e.g. Contoso Distribution List)
Click Save

6. Create an Anomaly (Update SQL DB)
Insert a record into the Azure SQL Database that will be picked up by Metrics Advisor in the next ingestion run to force an anomaly to be detected (i.e. INSERT a value into the STOCKS table that is significantly low).
INSERT INTO stocks VALUES('2020-11-09 00:00:00.000', 2500)7. Diagnose Incident (Incident Hub)
From the Metrics Advisor navigation bar, click Incident hub
Click Diagnose under Action
Toggle between the Diagnostic tabs (e.g. Metrics drill-down) to perform root-cause analysis
Note: If a metric has no dimensions, the root cause will be itself.

Resources
General
Product Page: https://aka.ms/MetricsAdvisor
Documentation: https://aka.ms/MetricsAdvisorDocs
Product Team: metricsadvisor@microsoft.com
Metrics Advisor & Anomaly Detector Advisors Microsoft Teams group
[Oct 2020] Detect anomalies in your data with Metrics Advisor
Video
[Sep 2020] New to Cognitive Services: Spatial Analysis and Metrics Advisor - Adina Trufinescu, Principal Program Manager (Compute Vision) and Qun Ying, Senior Program Manager (Anomaly Detector)
[Sep 2020] What’s new in Azure Cognitive Services [08:16] - Seth Juarez, Cloud Advocate
[Sep 2020] Introducing Metrics Advisor - Qun Ying, Senior Program Manager
API Reference
| Method | Name | API |
|---|---|---|
| POST | Create a new data feed | dataFeeds |
| POST | Create a new hook | hooks |
| POST | Create a new metric feedback | feedback/metric |
| POST | Create anomaly alerting configuration | alert/anomaly/configurations |
| POST | Create anomaly detection configuration | enrichment/anomalyDetection/configurations |
| DELETE | Delete a data feed | dataFeeds/{dataFeedId} |
| DELETE | Delete a hook | hooks/{hookId} |
| DELETE | Delete anomaly alerting configuration | alert/anomaly/configurations/{configurationId} |
| DELETE | Delete anomaly detection configuration | enrichment/anomalyDetection/configurations/{configurationId} |
| GET | Get a data feed by its id | dataFeeds/{dataFeedId} |
| GET | Get a hook by its id | hooks/{hookId} |
| GET | Get a metric feedback by its id | feedback/metric/{feedbackId} |
| POST | Get data ingestion status by data feed | dataFeeds/{dataFeedId}/ingestionStatus/query[?$skip][&$top] |
| GET | Get data last success ingestion job timestamp by data feed | dataFeeds/{dataFeedId}/ingestionProgress |
| GET | Get latest usage stats | stats/latest |
| POST | Get time series data from metric | metrics/{metricId}/data/query |
| GET | List all data feeds | dataFeeds[?dataFeedName][&dataSourceType][&granularityName][&status][&creator][&$skip][&$top] |
| GET | List all hooks | hooks[?hookName][&$skip][&$top] |
| POST | List dimension from certain metric | metrics/{metricId}/dimension/query[?$skip][&$top] |
| POST | List feedback on the given metric | feedback/metric/query[?$skip][&$top] |
| POST | List series (dimension combinations) from metric | metrics/{metricId}/series/query[?$skip][&$top] |
| GET | Query a single anomaly alerting configuration | alert/anomaly/configurations/{configurationId} |
| GET | Query a single anomaly detection configuration | enrichment/anomalyDetection/configurations/{configurationId} |
| POST | Query alerts under anomaly alerting configuration | alert/anomaly/configurations/{configurationId}/alerts/query[?$skip][&$top] |
| GET | Query all anomaly alerting configurations for specific anomaly detection configuration | enrichment/anomalyDetection/configurations/{configurationId}/alert/anomaly/configurations |
| GET | Query all anomaly detection configurations for specific metric | metrics/{metricId}/enrichment/anomalyDetection/configurations |
| GET | Query anomalies under a specific alert | alert/anomaly/configurations/{configurationId}/alerts/{alertId}/anomalies[?$skip][&$top] |
| POST | Query anomalies under anomaly detection configuration | enrichment/anomalyDetection/configurations/{configurationId}/anomalies/query[?$skip][&$top] |
| POST | Query anomaly detection status | metrics/{metricId}/status/enrichment/anomalyDetection/query[?$skip][&$top] |
| POST | Query dimension values of anomalies | enrichment/anomalyDetection/configurations/{configurationId}/anomalies/dimension/query[?$skip][&$top] |
| GET | Query incidents under a specific alert | alert/anomaly/configurations/{configurationId}/alerts/{alertId}/incidents[?$skip][&$top] |
| POST | Query incidents under anomaly detection configuration | enrichment/anomalyDetection/configurations/{configurationId}/incidents/query[?$top] |
| GET | Query incidents under anomaly detection configuration | enrichment/anomalyDetection/configurations/{configurationId}/incidents/query[?$top][&$token] |
| GET | Query root cause for incident | enrichment/anomalyDetection/configurations/{configurationId}/incidents/{incidentId}/rootCause |
| POST | Query series enriched by anomaly detection | enrichment/anomalyDetection/configurations/{configurationId}/series/query |
| POST | Reset data ingestion status by data feed to backfill data | dataFeeds/{dataFeedId}/ingestionProgress/reset |
| PATCH | Update a data feed | dataFeeds/{dataFeedId} |
| PATCH | Update a hook | hooks/{hookId} |
| PATCH | Update anomaly alerting configuration | alert/anomaly/configurations/{configurationId} |
| PATCH | Update anomaly detection configuration | enrichment/anomalyDetection/configurations/{configurationId} |